You lifted the hood.
Here’s the engine.
This site is a design system applied to itself: shared tokens, a small set of components, and pages generated by code from real project files. Same way I’d run it on a product team, at the scale of one.
parallax clamped to ±36px
ambient light: 2 blurred fields, 4% lerp to cursor
prefers-reduced-motion: all off
Started from the live Squarespace site: every case study, the archive and the about page, read and inventoried before anything was redrawn. Then each one rewritten around decisions instead of deliverables.
Built with Claude in Cowork, from Squarespace to this.
0→1 MVPs · Healthcare · Care coordination · Data
Closing care gaps with data care teams can act on.
Three months to turn FHIR care plans and social determinants of health into an MVP prototype simple enough for care teams, and convincing enough to sell.
- Role
- Lead Designer, via Optimity Advisors
- Team
- UX & Design Managing Director, a second designer, a PM
- Client side
- Product Manager, CTO, SVP of Digital Health Platform Product
- Timeline
- Three months, daily iterations
Overview
A new care coordination and analytics platform needed something to show buyers. Not slides. A working product story.
I led the design of an interactive MVP prototype that followed a scripted sales flow across two users: case managers on the care team, and population health managers running programs. The goal was to make complex data, FHIR eCarePlans and social determinants of health (SDOH) metrics, accessible and actionable. The prototype aligned the client's teams, carried their sales demos, and grew our engagement by nearly 4x, adding collateral and sales decks to the scope.
Multidimensional data, aggressive timeline.
How might we translate multidimensional healthcare data into intuitive, actionable tools for different users, under an aggressive timeline?
Start from what has to beat the market.
Discovery ran fast and in parallel: stakeholder interviews to understand clinical workflows and expectations, rapid secondary research on SDOH, FHIR eCarePlans and population health, two personas and journey maps to find where intervention should happen. The whiteboard turned into a kitchen sink of screenshots, positioning docs and inspiration. One page in it framed the whole job: what every care platform already promises, and where this one had to be different.
- 1Behavioral risk assessments drive family care plan goals, aligned with SDOH condition risksInstead of: behavioral health risk assessment with sdoh
- 2FHIR care plan with intelligent care incentives based on spend insightsInstead of: integrated care plan
- 3A daily tracker captures mood, habits and living activitiesInstead of: personal health and fitness tracking
- 4A personal intervention engine auto-alerts the care team to behavior gaps, fastInstead of: care team risk alert
- 5SDOH condition alerts help the care team remove barriers to careInstead of: access to care support
- 6A personalized care plan activates chronic and wellness goals with incentives tied to healthy habitsInstead of: personalized goals and incentives
Key insight. Users needed real-time visibility into patient risk and straightforward action paths, without parsing clinical data by hand.
The wellness wheel at the core.
We defined two modules: Care Coordination for case managers, and Population Analytics for population health managers. Underneath both sat one loop: a goal, the member's behavior, a deviation, an alert, an intervention, an incentive, a change in behavior, and an outcome. Everything orbits the member profile: demographics, conditions, SDOH and attribution. On the whiteboard I put it on a wheel. Here it is with Charlie Fallon, the member our demo followed.
Demographics · conditions · SDOH · attribution
Charlie's care plan in the EMR includes bi-annual lab testing, PCP visits and dietary recommendations, plus Entresto 49/51 mg twice daily. Claims show his last refill was six weeks ago, two weeks overdue.
Five domains instead of a hundred data points.
FHIR care plans and SDOH data are multidimensional by nature. The Health Foundations Framework grouped them into five actionable domains, each with a score a case manager can read in a second. These are Charlie's.
Wellbeing sits at 63. Steady enough to watch, not to act on. Tap Nutrition to see where the care plan points first.
From cohort to patient to proof.
We wireframed dashboards, cohort navigation, patient profiles and analytics, validated flows in low fidelity with stakeholders, then built a high-fidelity interactive prototype. Conditional logic and scripted flows simulated the smart behavior, and daily standups kept the loop tight. Follow the demo path.
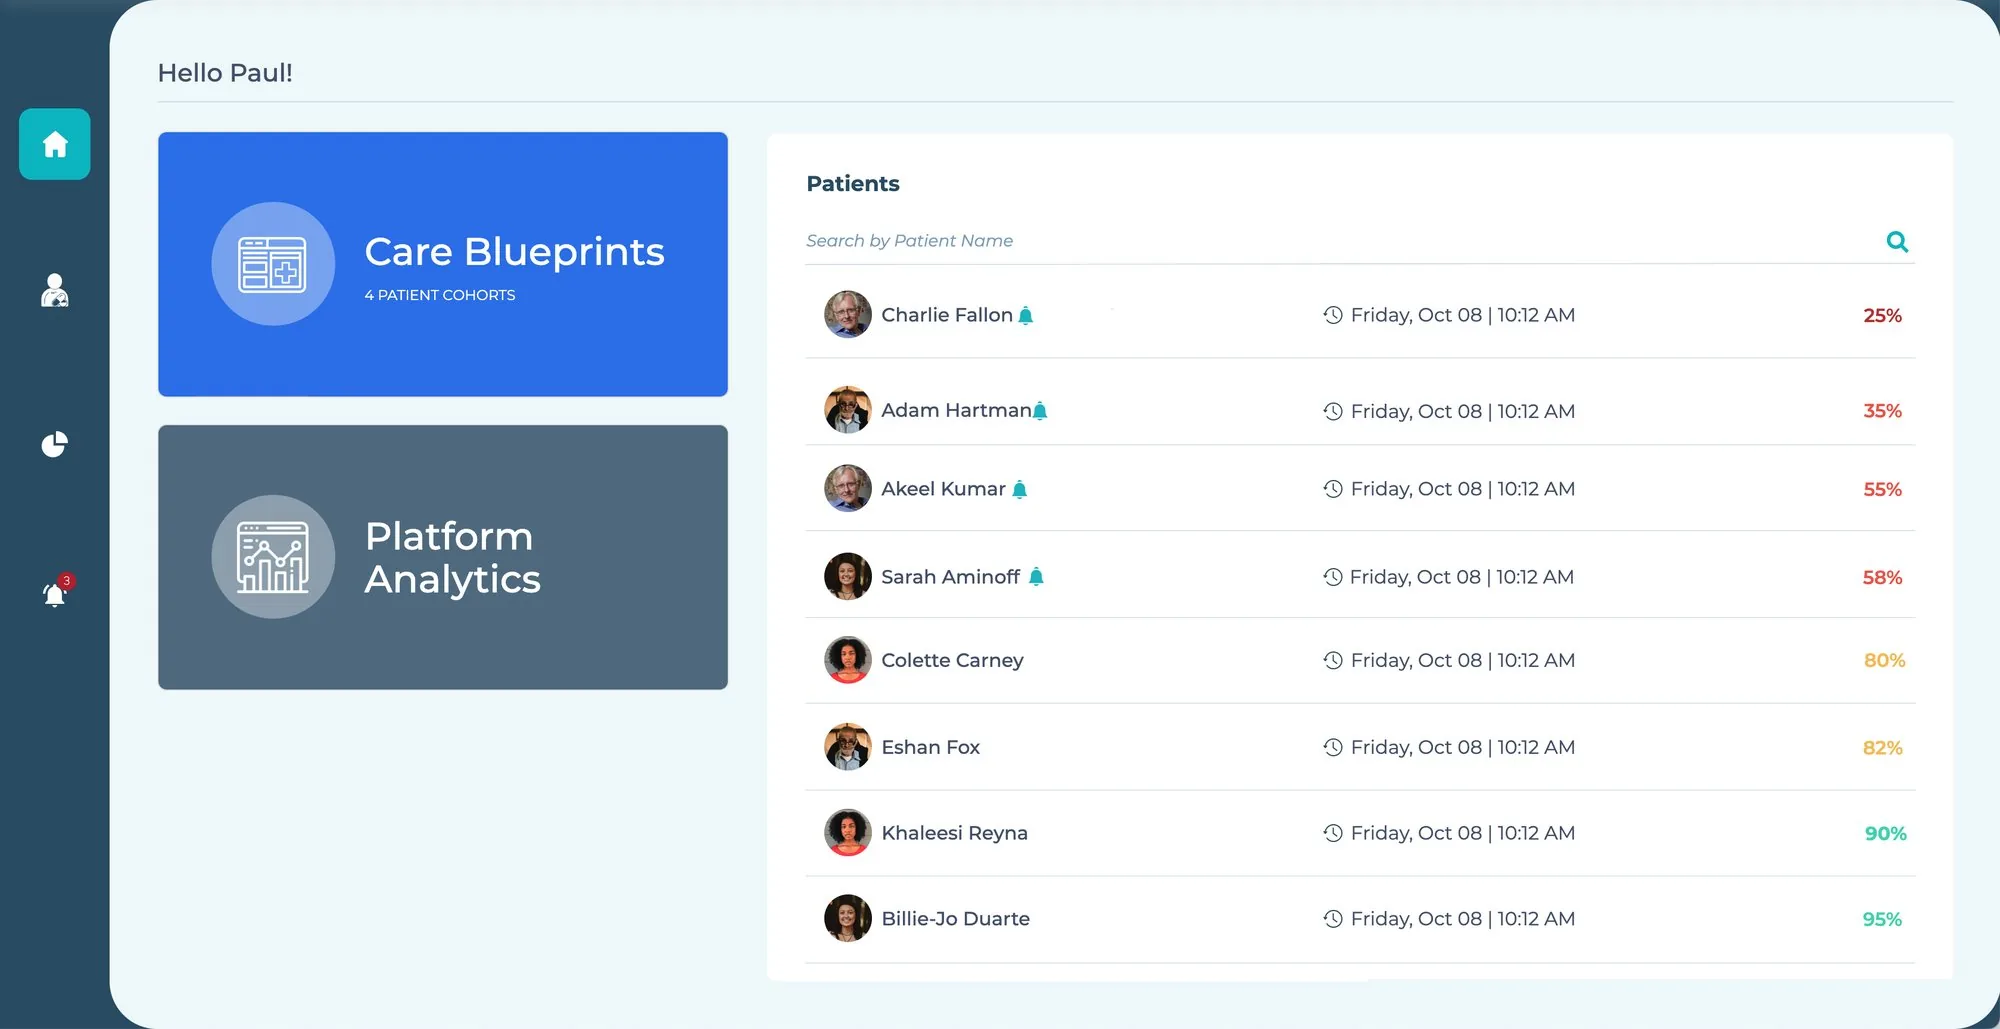
Paul lands on two doors, Care Blueprints and Platform Analytics, next to his patients ranked by progress, with alerts flagged inline.
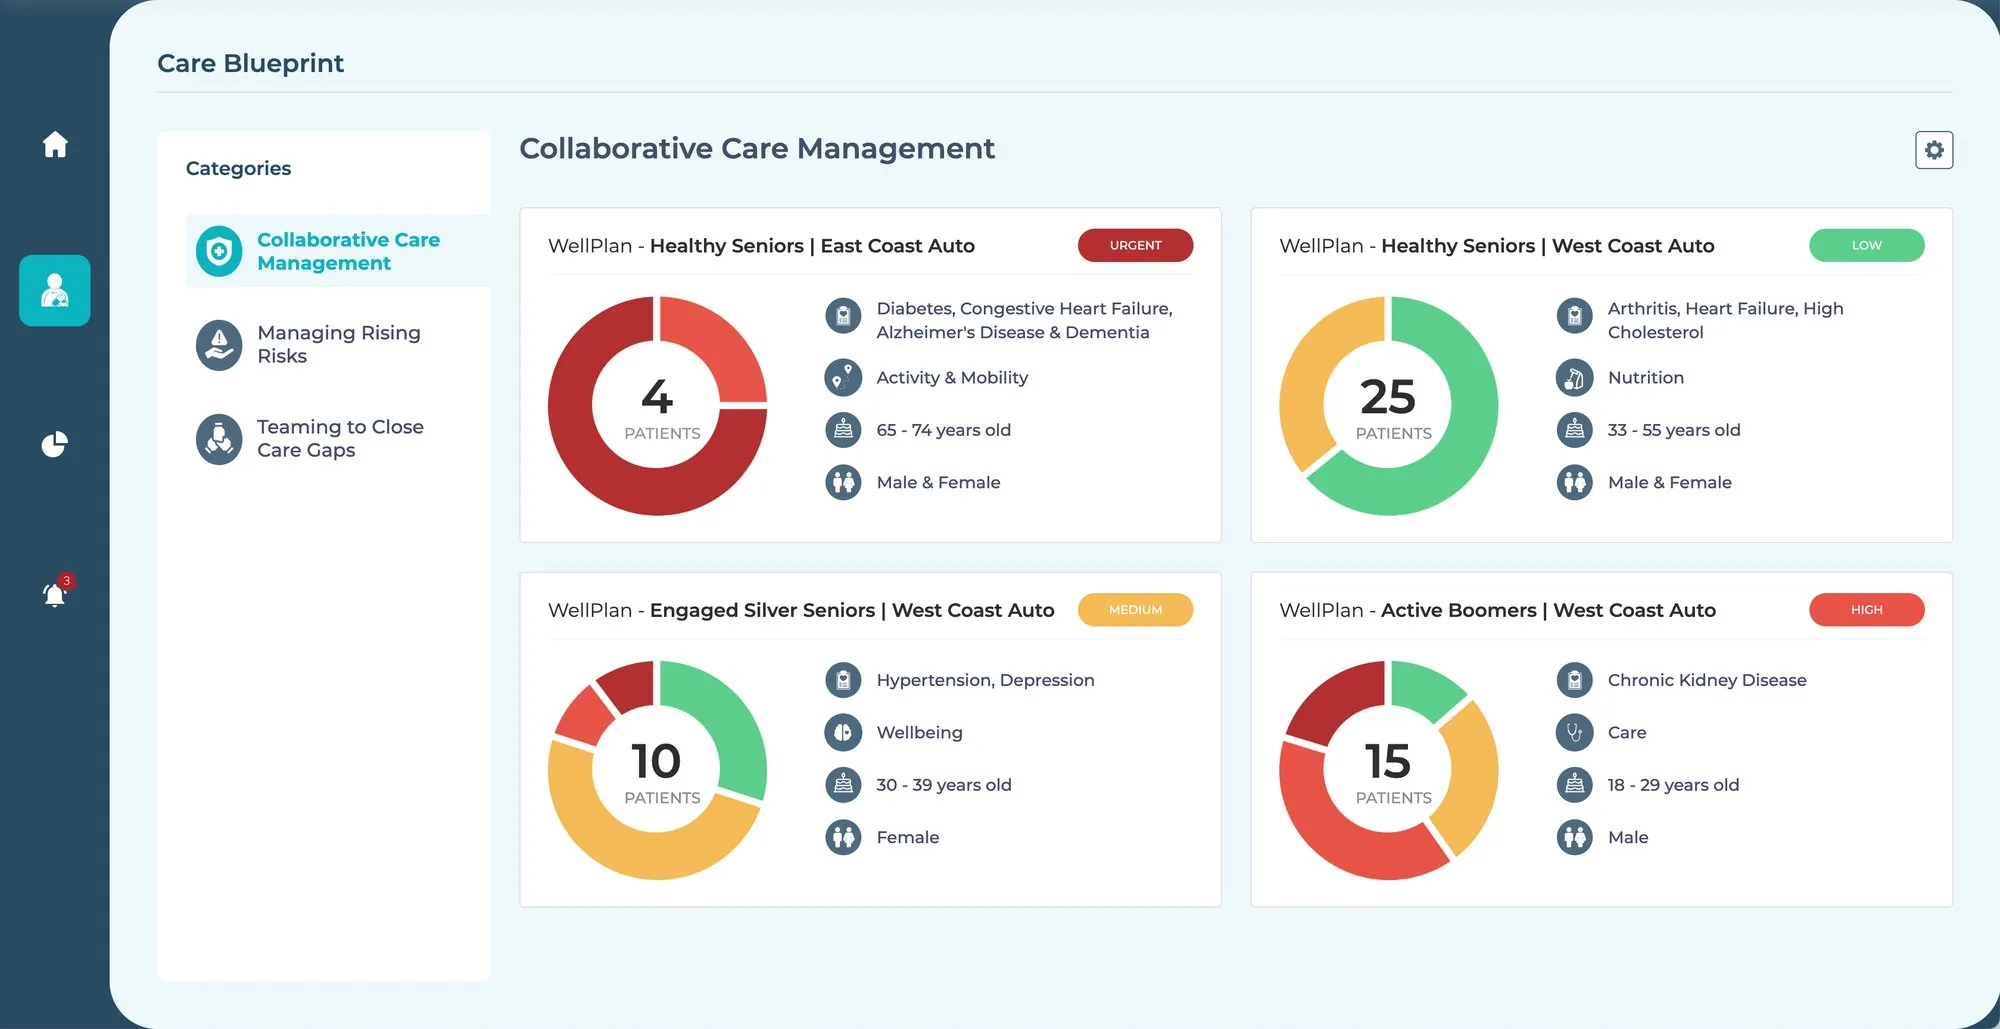
Clear cohort views show each patient group's status and care priorities at a glance, with urgency called out before you open anything.
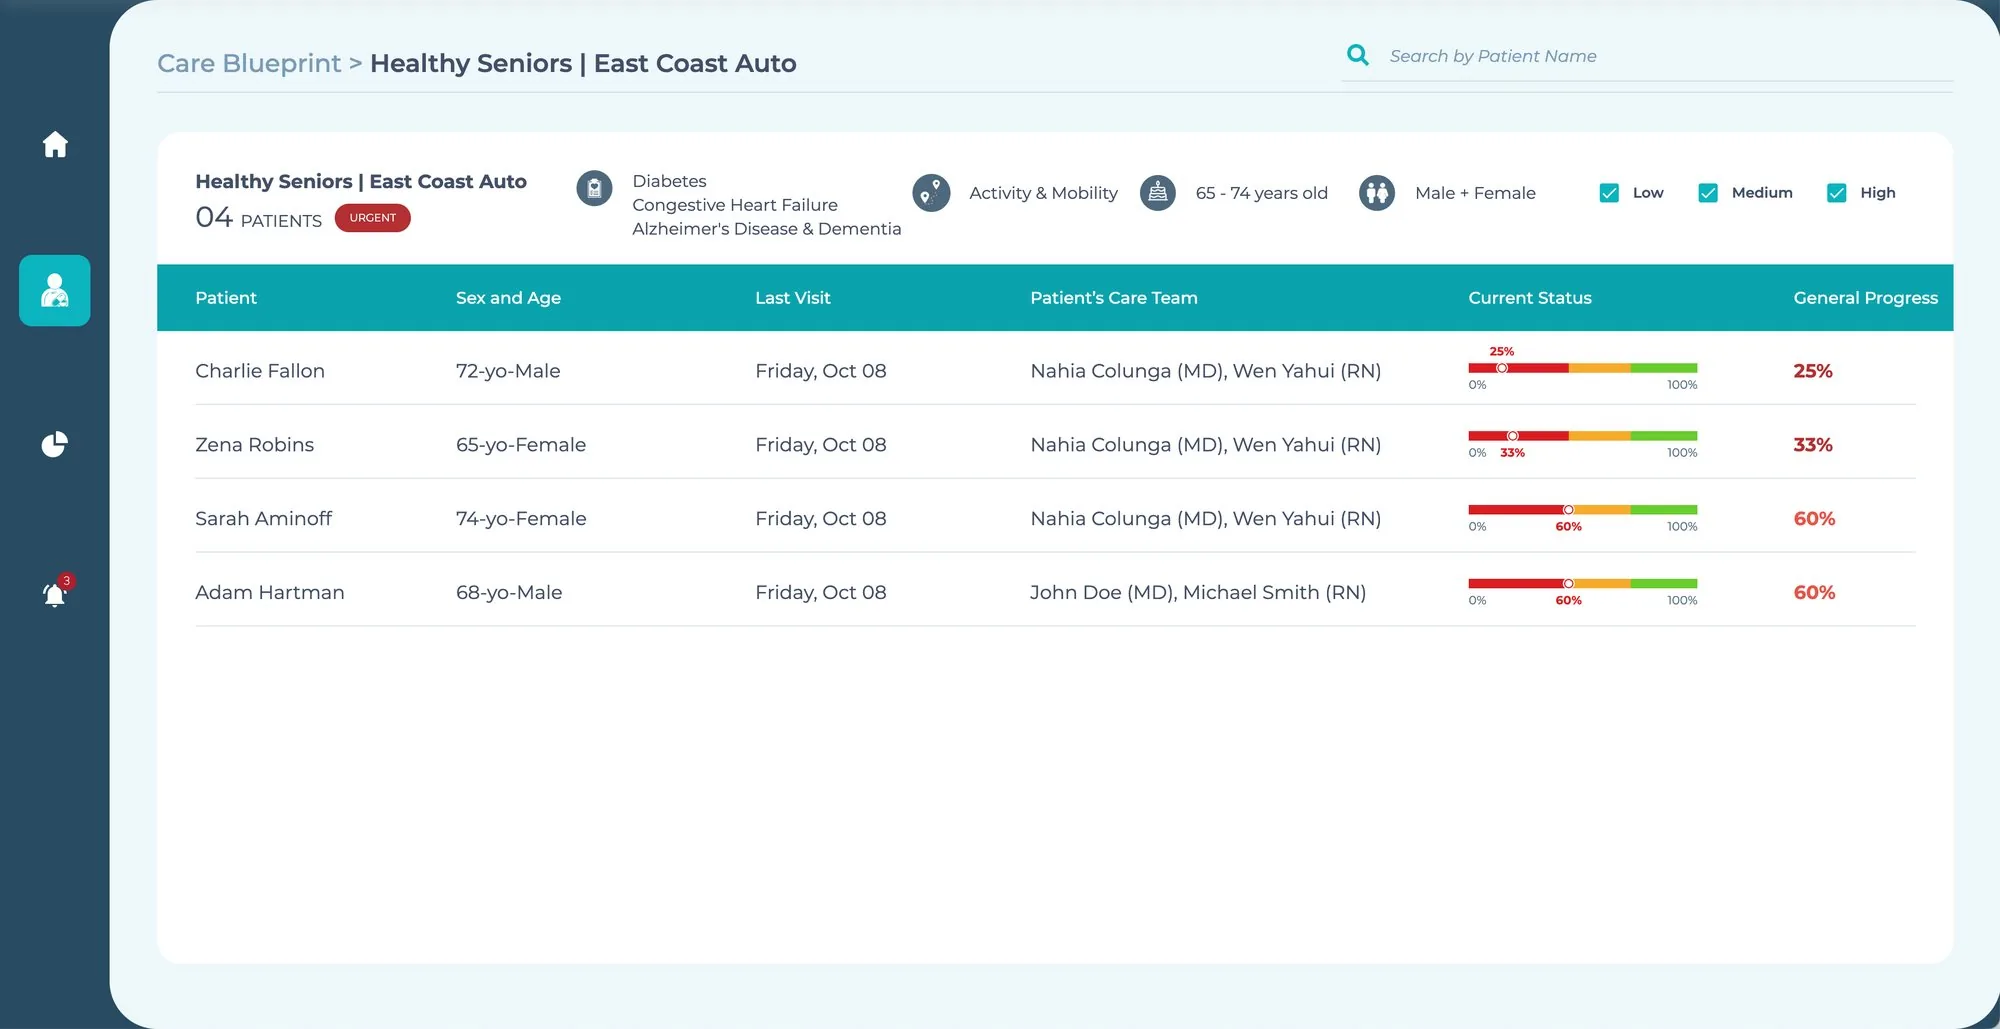
At-a-glance health trend indicators, built to trigger quick action from managers instead of a deep dig through records.
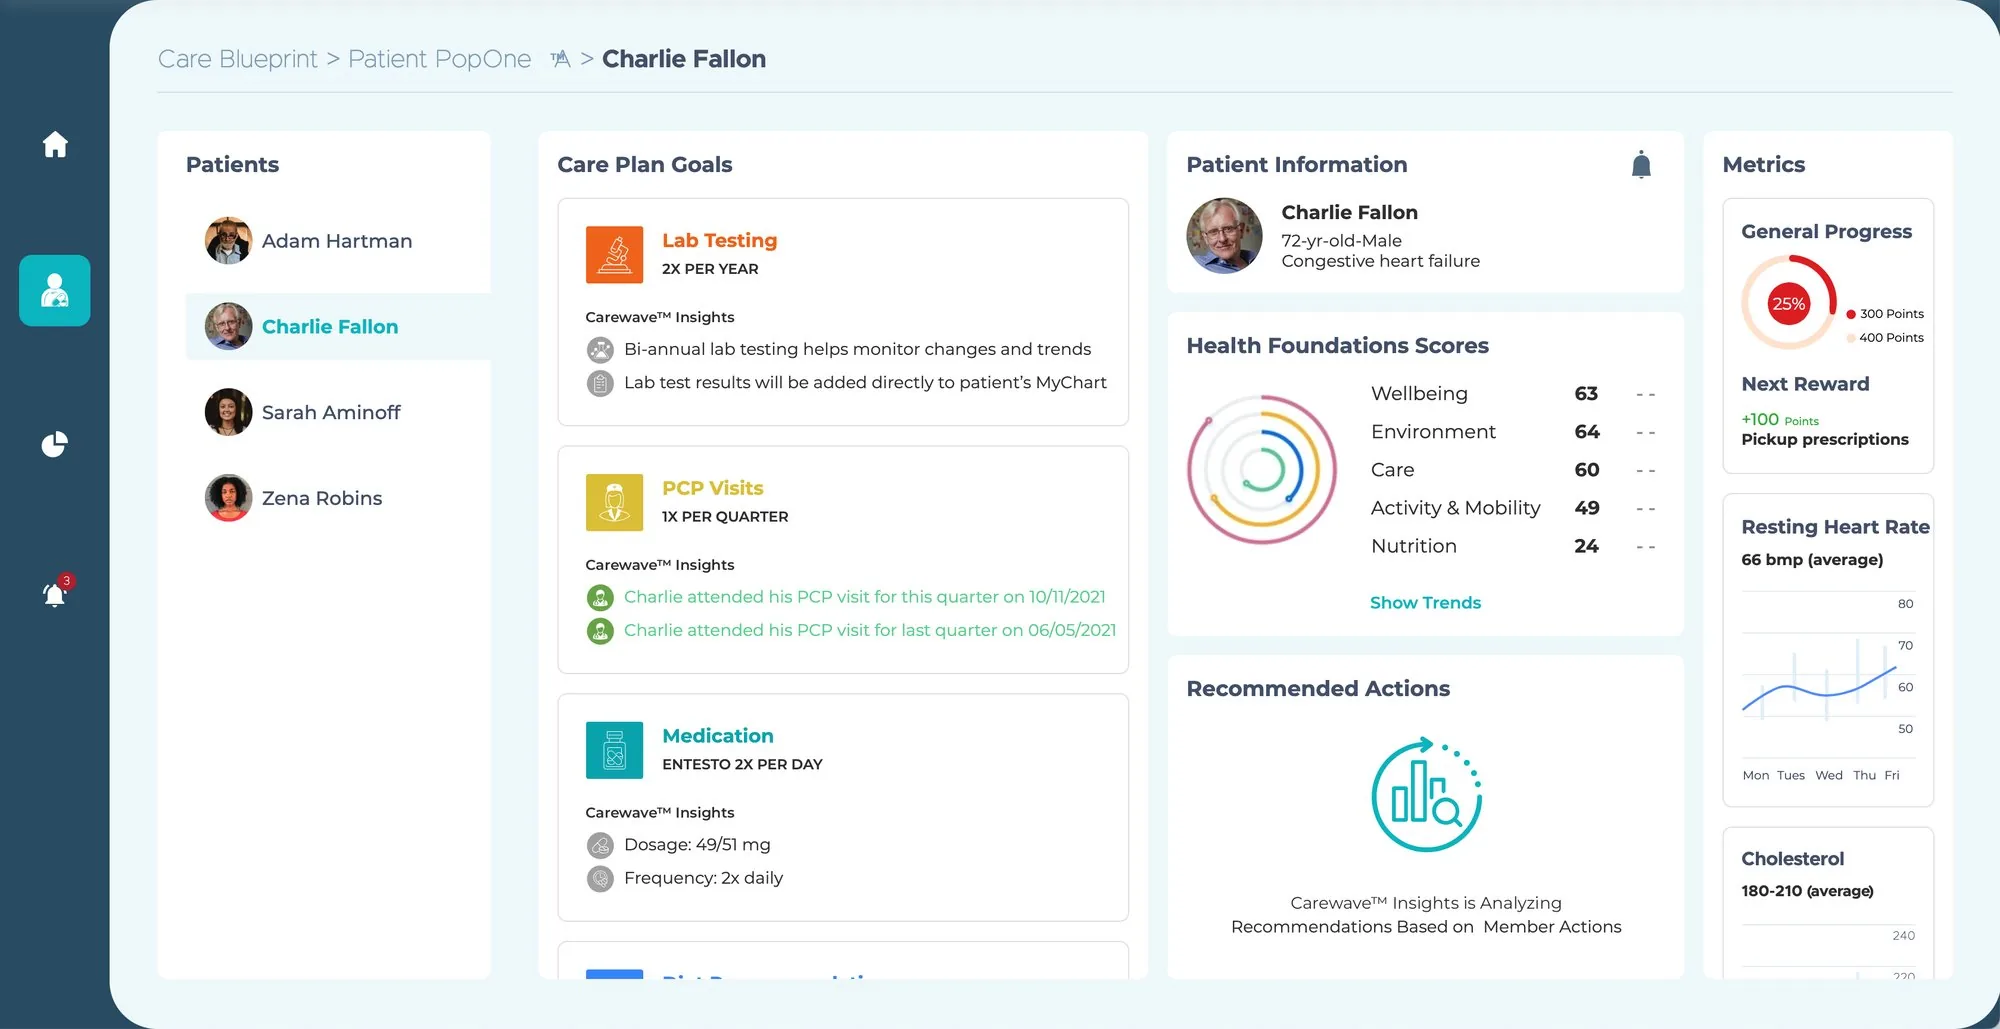
A complete snapshot blending care plan goals, Health Foundations scores, trends and the next recommended actions.
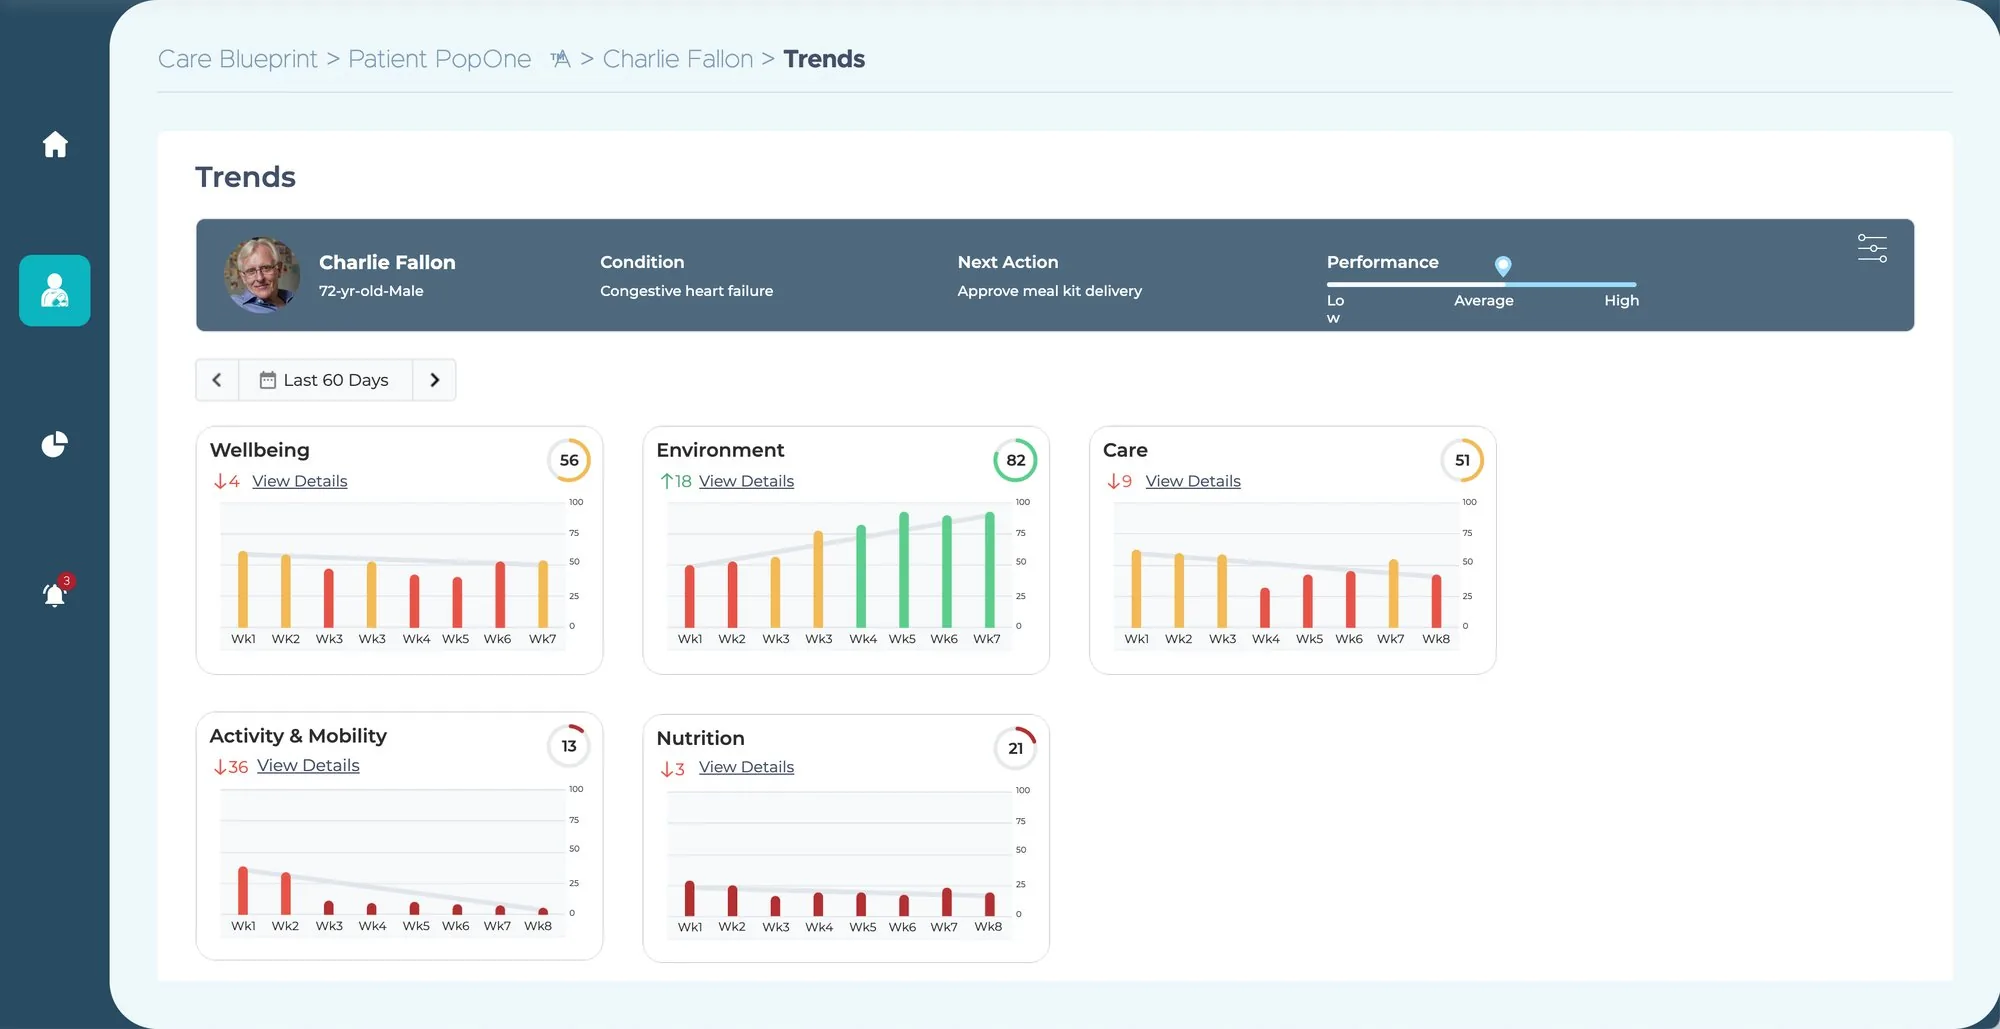
Engagement and wellbeing over the last 60 days, per domain, with the next action right in the header: approve meal kit delivery.
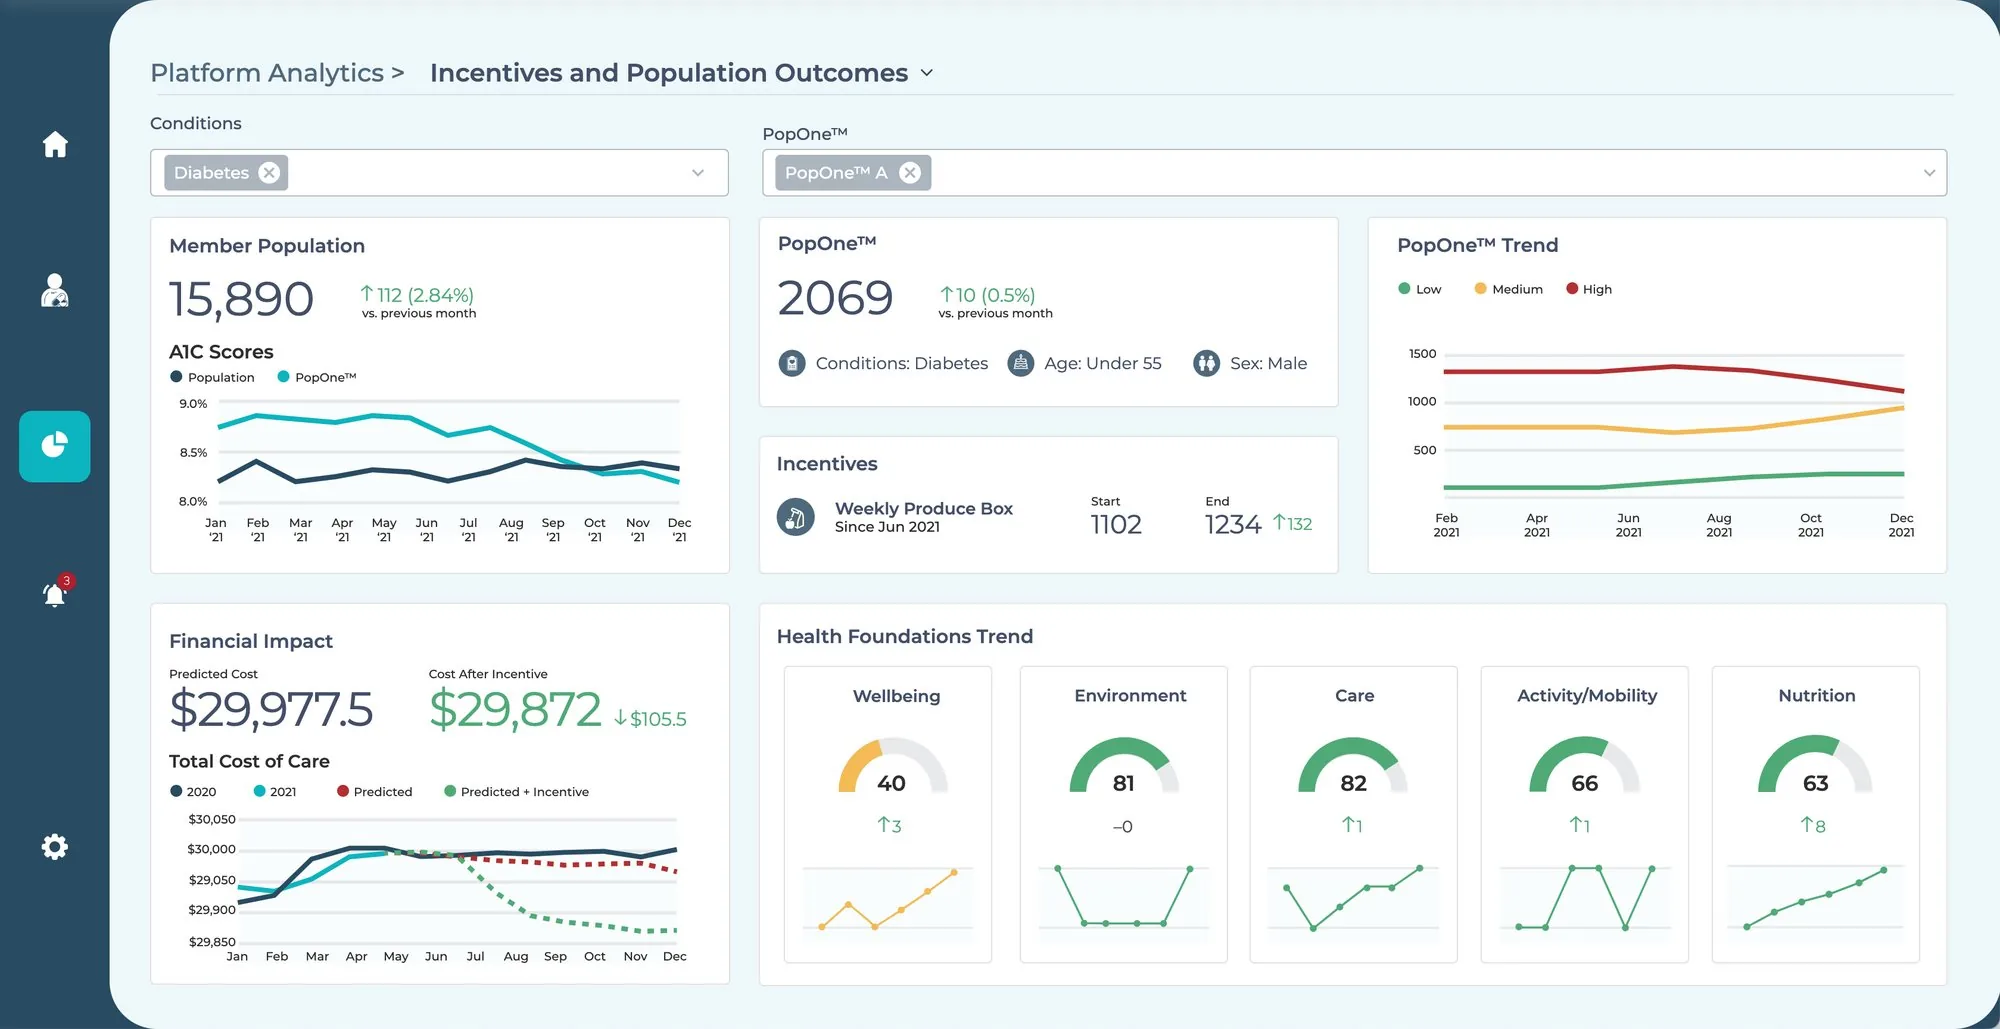
Sara's view links interventions to outcomes and cost of care: a weekly produce box, A1C trends, and predicted cost with and without the incentive.
Smart behavior is just rules someone can edit.
The demo felt smart because an administrator could set the rules behind it. On Sara's side, Health Foundations profiles define the sources, ranges and scoring for every domain. Each domain lists the data behind it, from FHIR eCare Plans to Rx claims. WellPlan turns score ranges and trends into interventions, incentives and alerts for a specific population.
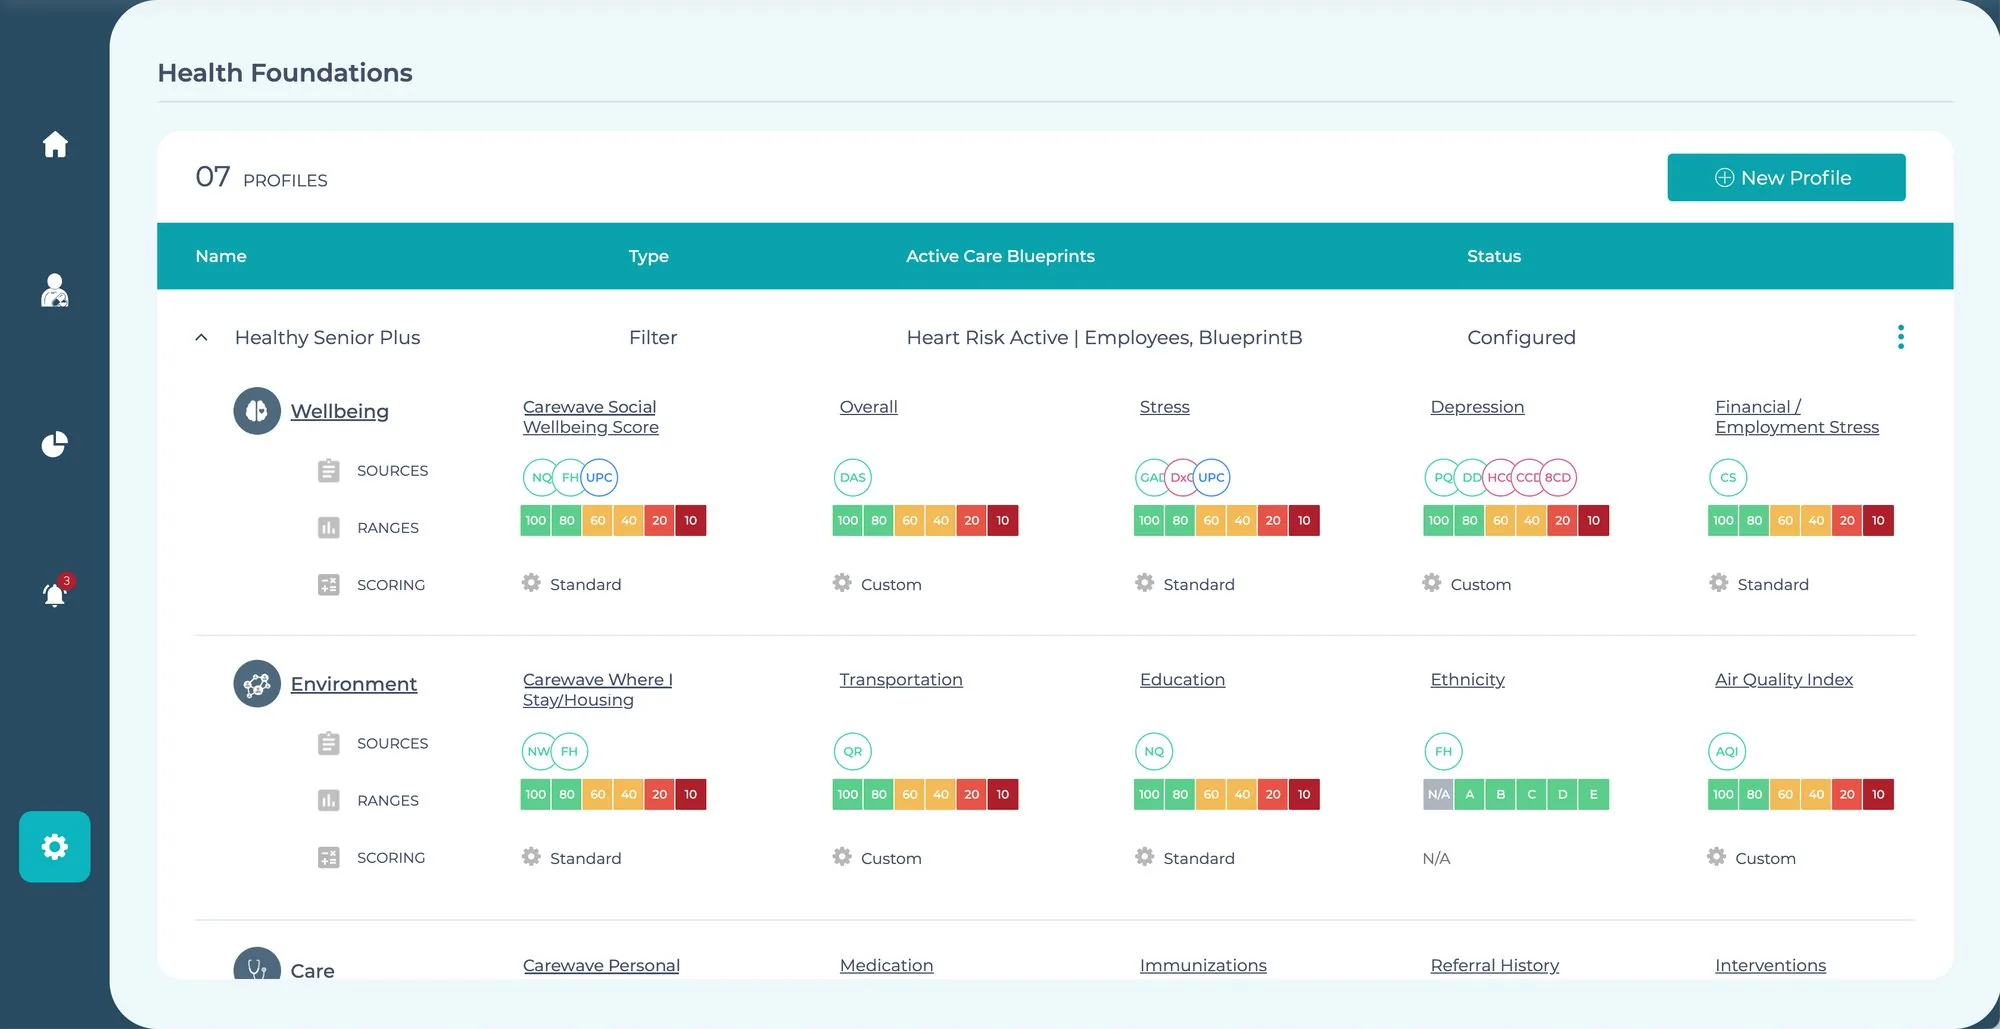
Each profile sets the data sources, score ranges and scoring method, standard or custom, for every measure in every domain.
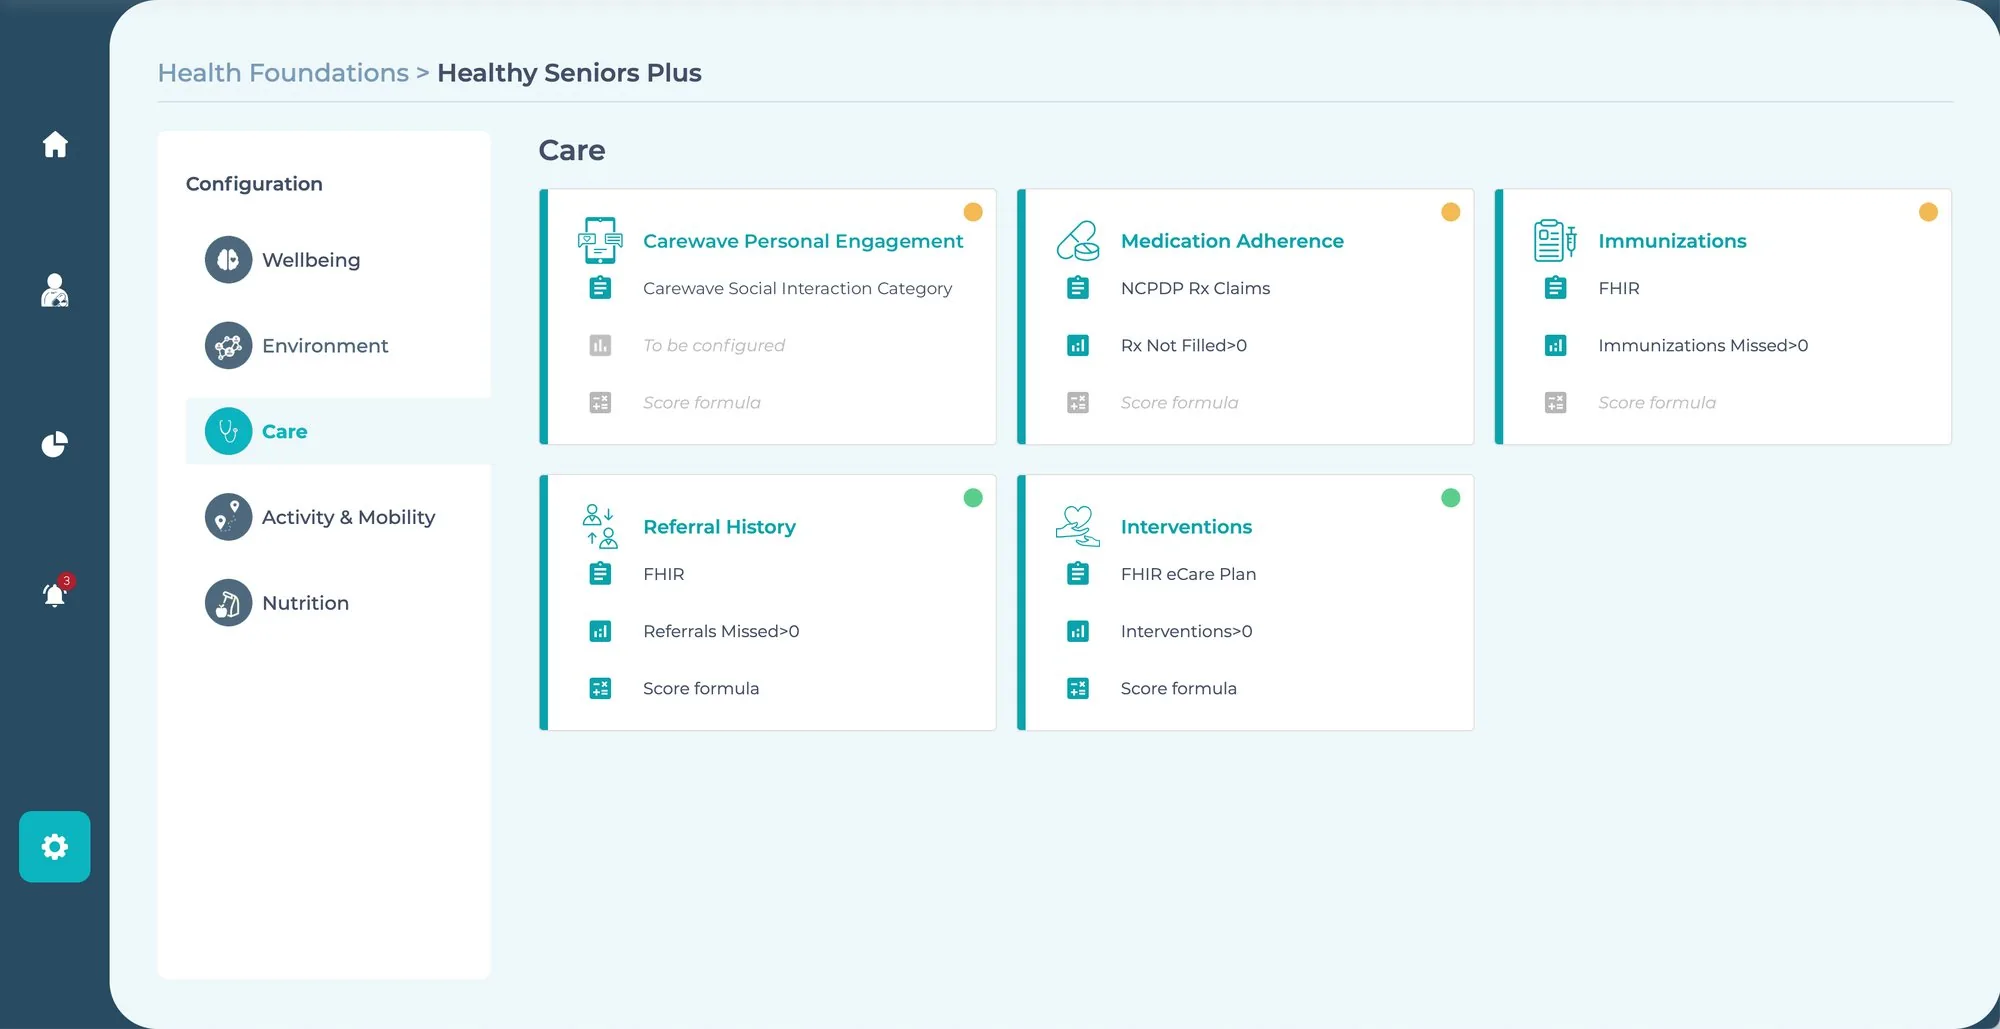
Inside a domain, every measure names its source, its trigger and its score formula. Orange dots flag what still needs configuring.
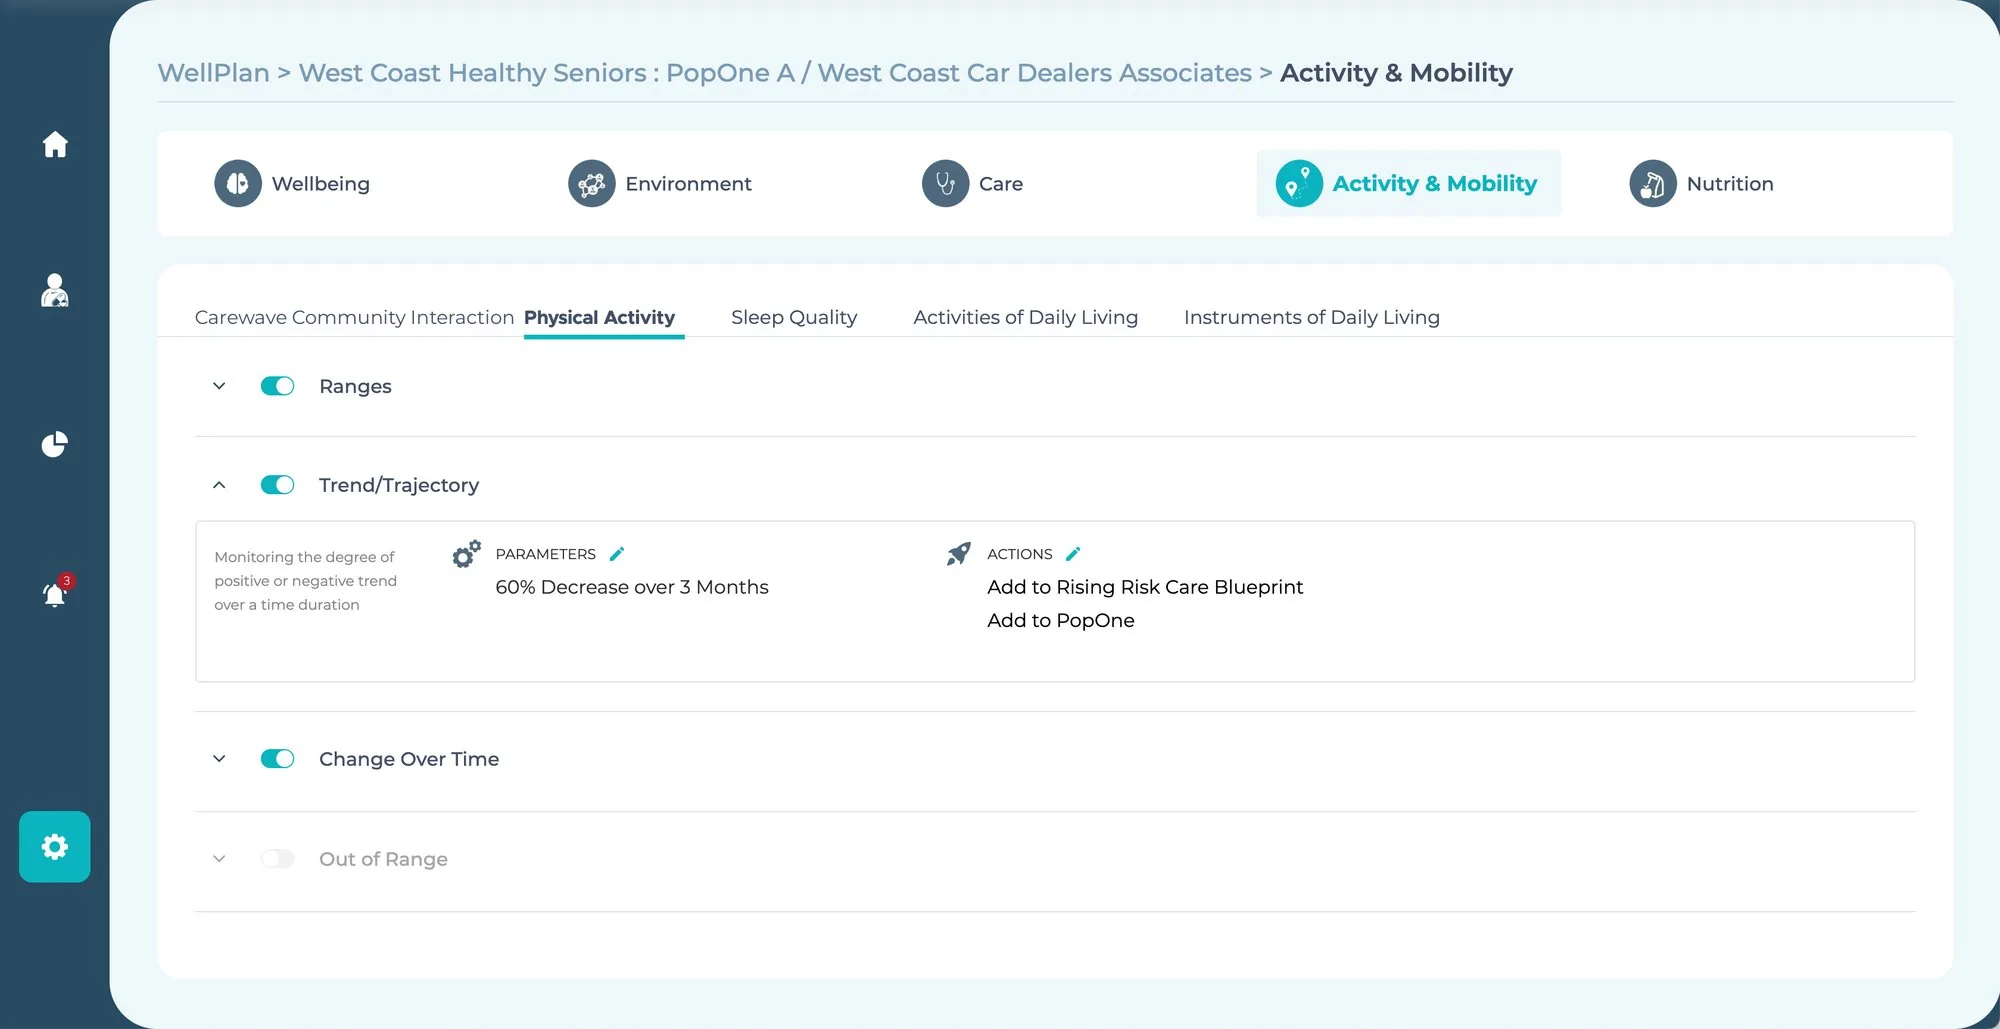
Rules can watch direction, not just level: a 60% drop in activity over three months moves a member into the Rising Risk blueprint.
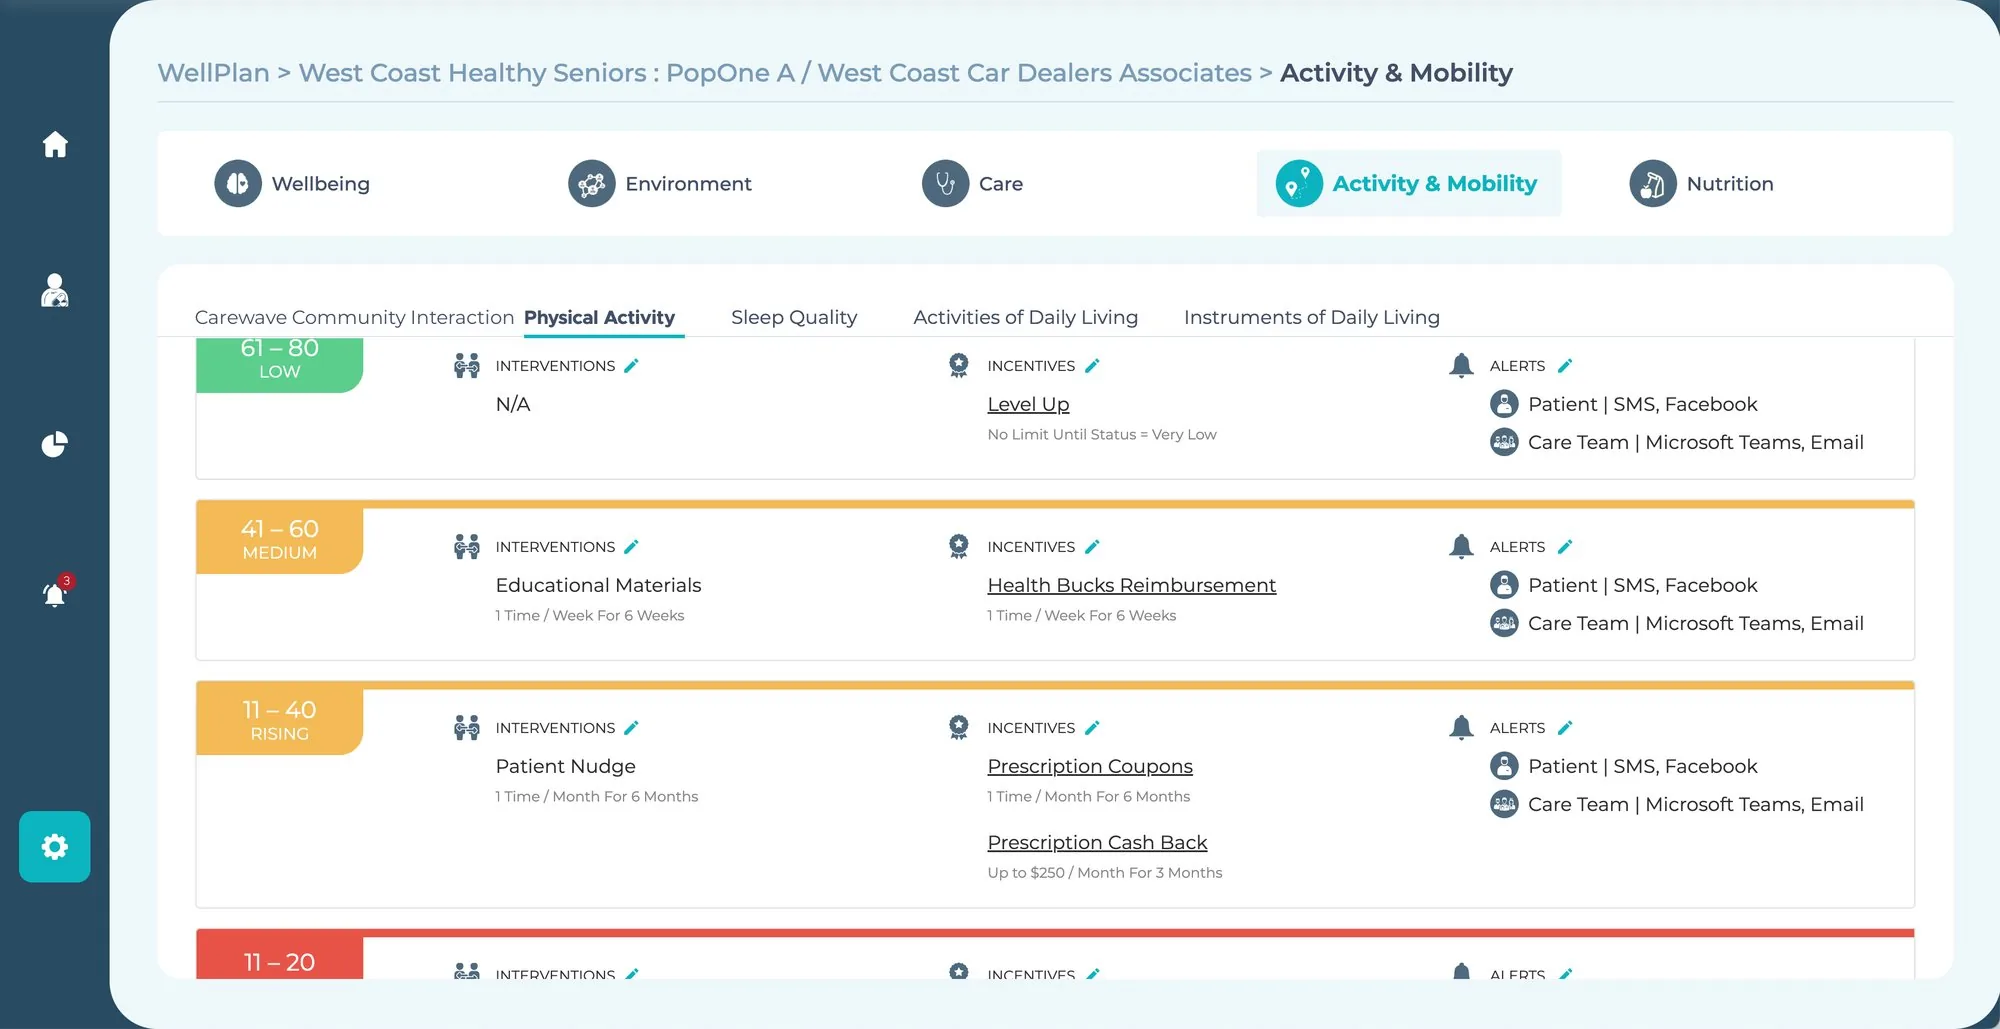
Each score range carries its own interventions, incentives and alert channels for the member and the care team.
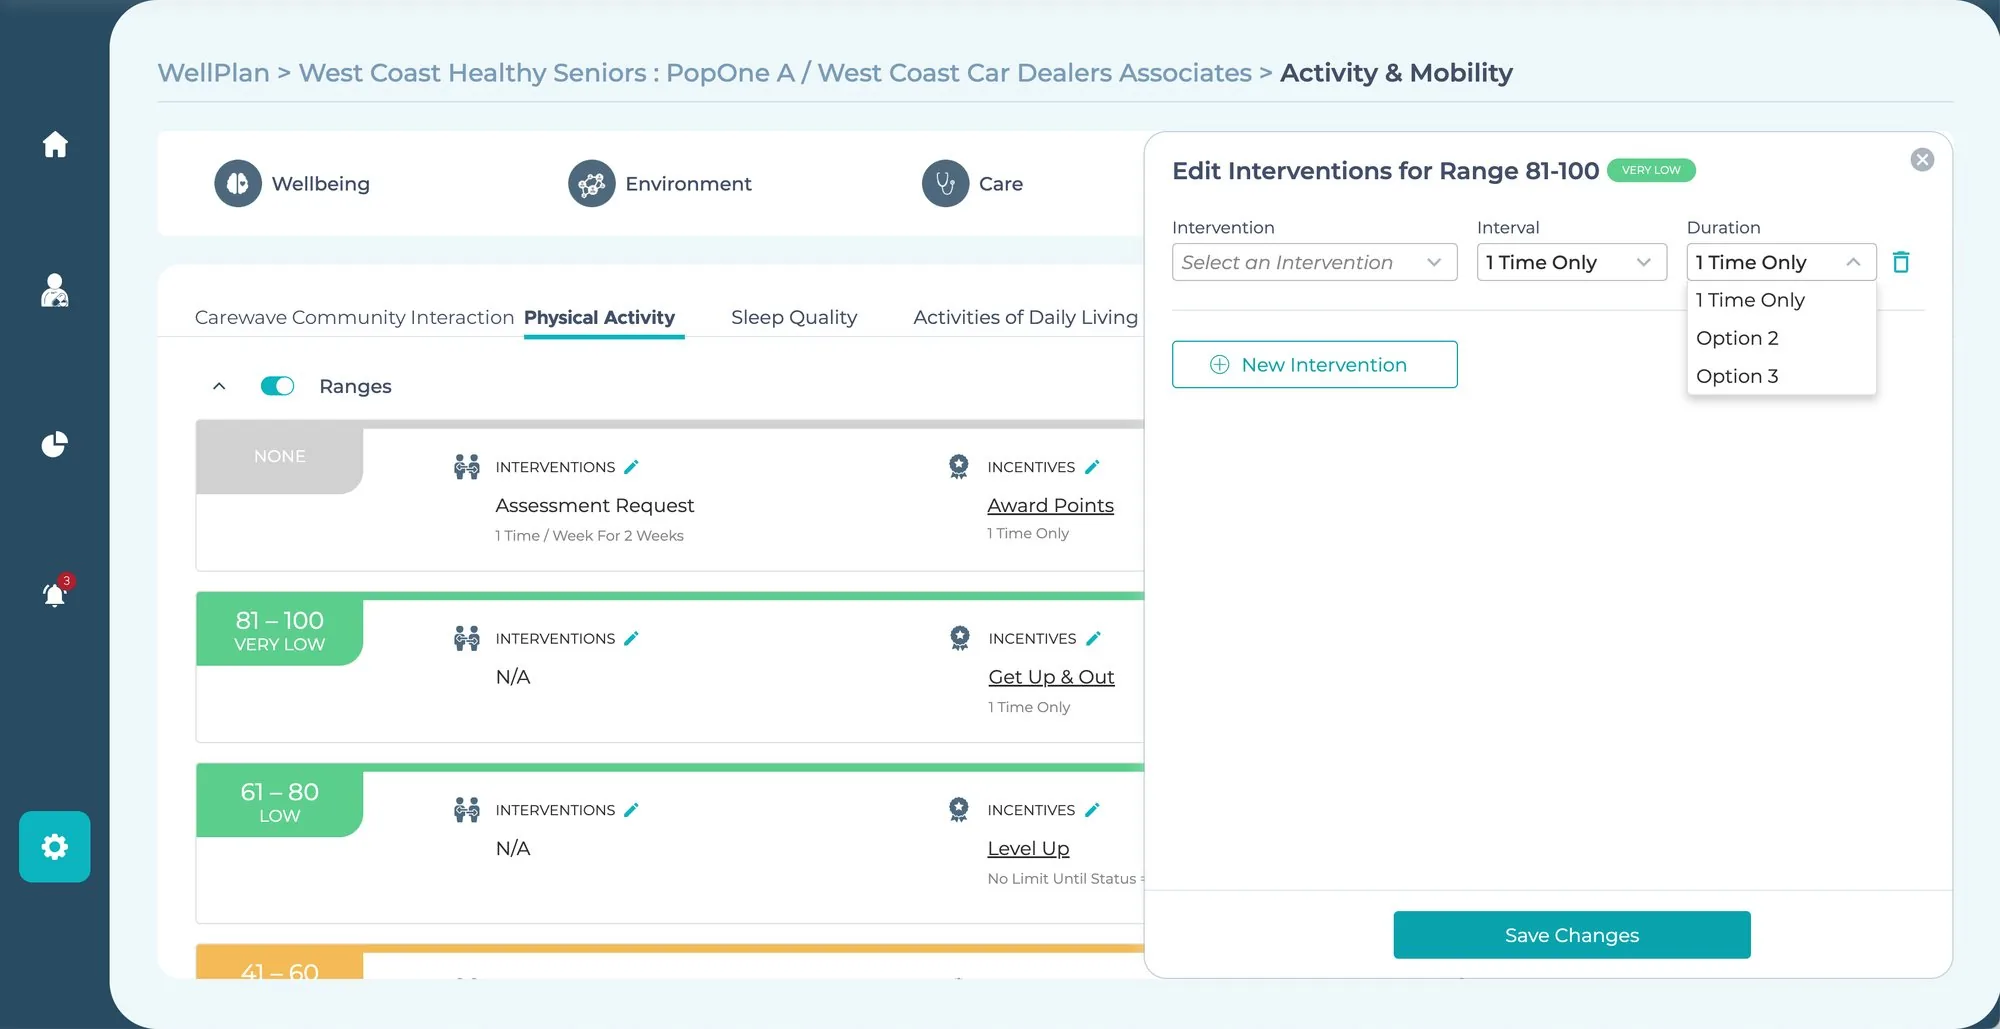
Editing stays in context: pick an intervention, an interval and a duration for the range, without leaving the plan.
A demo is a script, so we storyboarded it.
The client demo was storyboarded card by card before a single screen was polished: the problem, the platform, Charlie's story through each step of the wheel, then the financial case. Stakeholder dry runs tested usability, navigation clarity and narrative flow, and every round of feedback went straight back into the prototype.
Analytics closed the story: complex numbers turned into visual narratives, linking interventions to health outcomes and cost of care.
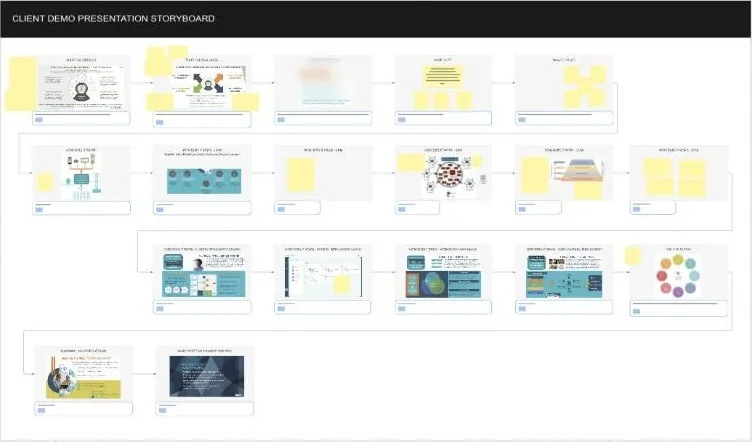 The client demo storyboard from the whiteboard.
The prototype became the client's demo tool and helped win early pilot programs. It gave business, clinical and engineering teams one tangible product vision to argue about, instead of three different ones.
A scripted flow beats a static deck.
A realistic flow made the platform's value tangible and persuasive in a way presentations couldn't.
Stakeholders as design partners.
Treating stakeholders as active partners, daily, sped up clarity, consensus and quality.
Good UX unlocks business outcomes.
Investing early in user-centered design gave the client a better prototype and a better product roadmap.